

Gasoline Hybrid vs. Diesel on a Forest Harvester
Read case study
January 9, 2026

.avif)
11 Dec 2025
10 min read
The automotive sector is dominated by a handful of big names – so how, as a supplier with a promising new technology, can you get noticed and demonstrate to your potential customers why they should be working with you? There’s no more compelling story than swapping your powertrain technology into an existing vehicle and showing how it outperforms the original system. What if you could do this virtually, saving time and money over commissioning a traditional demonstrator platform? This is where ePOP steps in.
Benchmark the performance of powertrain components across a range of metrics, including energy consumption, cost and mass by swapping combinations within a set of vehicles and comparing to the OEM references.
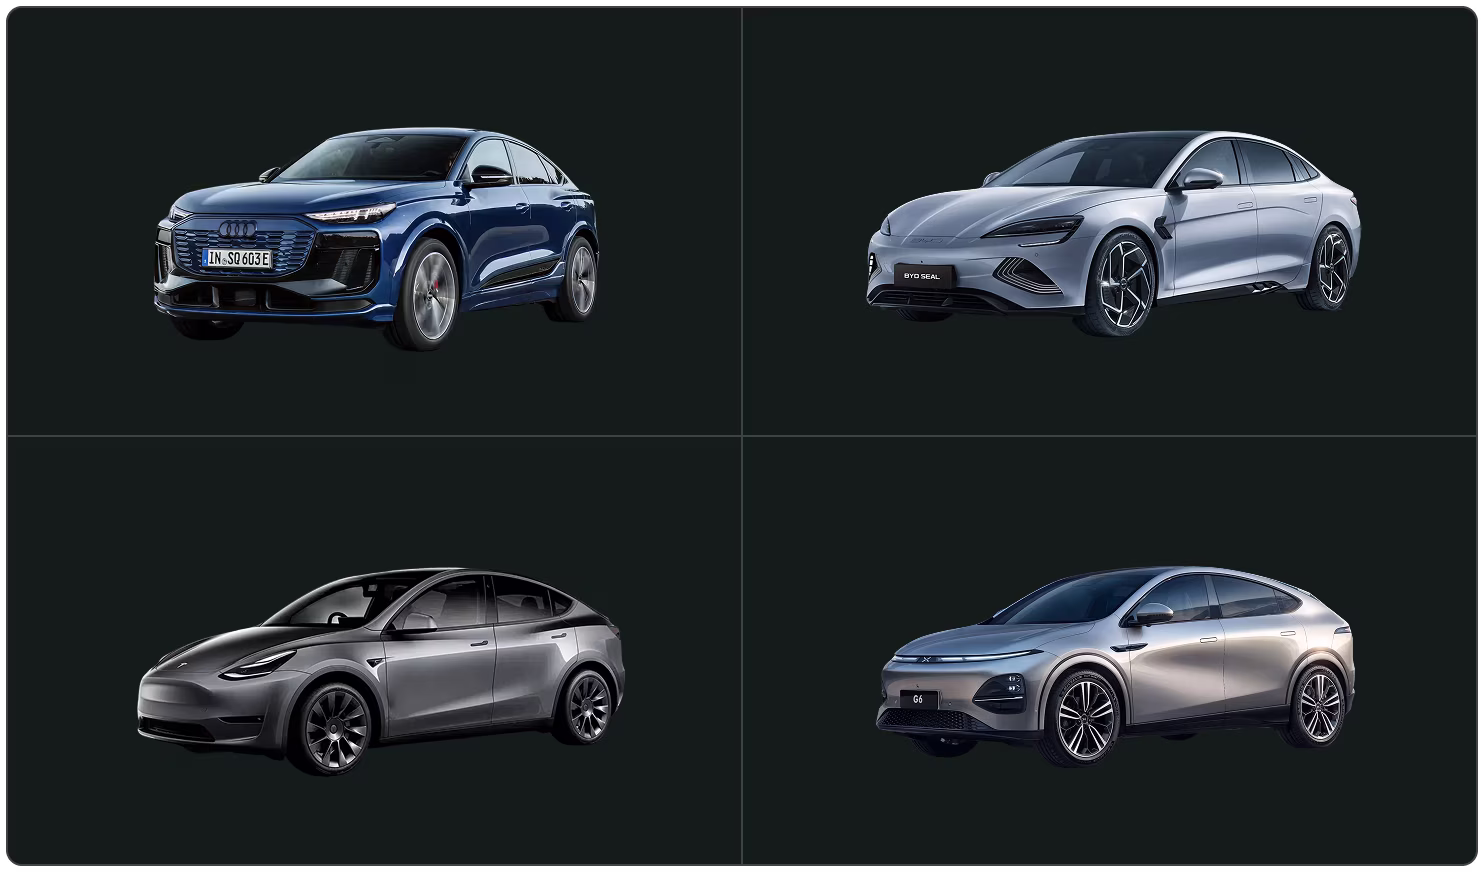
Data from A2MAC1 was used to reverse engineer powertrains from a set of established EVs – with global representation including a Tesla from the USA, an Audi from Germany and a BYD and XPENG from China.
Detailed models of the inverters, motors and transmissions were created and imported into ePOP’s component library alongside the high-level parameter sets used to define the vehicle models.
.avif)
Data from the component library can be explored and modified in ePOP’s user interface – for example in this project, the transmission torque ratings were manually increased to ensure compatibility between all motors and transmissions for the simulations.
In the first stage of analysis, the reference OEM benchmark configurations were created and simulated over the WLTP drive cycle with energy consumption predictions compared to the official figures declared by the OEMs. The vehicle parameters were then iteratively refined to ensure a good match between the virtual benchmarks and the quoted figures.
In the second stage, a full set of mix & match study case combinationswere created in ePOP and simulated over the same WLTP drive cycle – giving over1000 different data points to explore.
.avif)
The combinations are intuitively generated within ePOP’s Study Configuration area, where the user can select from a set of built-in powertrain architectures and then choose components from the library to populate them through a simple check-box tree. ePOP automatically creates a full-factorial set of powertrain combinations but also allows the user to apply a variety of pre-filters to downselect based on criteria such as wheel torque and vehicle speed. By removing powertrains that are unable to deliver vehicle performance requirements, the process of simulation and analysis can be streamlined.
In the third stage, a multi-attribute comparison between the ‘Frankenstein’ vehicles and the OEM benchmarks was completed using ePOP’s post-processing interface to uncover the stories hidden within the data.
Simulation in ePOP of the OEM reference benchmarks achieved a close match with the official energy consumption figures for WLTP:

Within the ePOP post-processing interface, the OEM reference benchmarks can be selected as points of interest (POIs), giving a visual representation of how the ‘fantasy’ powertrains compare:

With points to the bottom left of each benchmark, meaning lower mass and more efficient, there’s promise in finding combinations that improve upon the original equipment.
Take for example the Tesla Model Y….what if one of the motors from the BYD Seal were swapped in?
.avif)
Fitting the rear motor from the BYD Seal to the Tesla saves over 5 kg in mass and yields a ~5% increase in efficiency over the WLTP drive cycle, which translates to an additional ~21 km of predicted range and a nearly 1.2 tonnes of CO2e saved over the vehicle’s lifespan.
The only fly in the ointment is the lower torque of the BYD motor resulting in a ~20% reduction of peak torque at the wheels. This necessitates an additional 1.3 seconds to complete the 0-100 kph sprint.
.avif)
Diving deeper into the data using ePOP’s residency plot functionality, it’s plain to see how dropping in the BYD motor has changed the overall powertrain system efficiency map – boosting peak efficiency to over 96% and massively increasing efficiency at higher motor speeds (eg by ~6% at 12,000 rpm). This hints that there could be scope to optimise the Frankenstein BYD-Tesla; increasing the gear ratio to have the motor running at higher speed for a given vehicle speed could both improve efficiency and claw back some of the lost acceleration.
For a second example, consider swapping one or both of the motors in the Audi SQ6 for the motor from the XPENG.
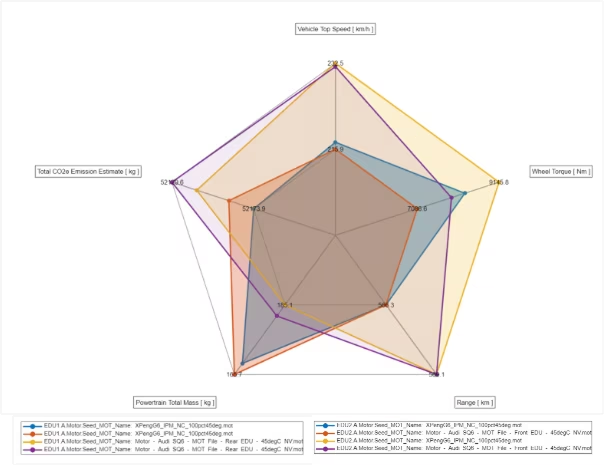
Here, the purple polygon represents the Audi SQ6 benchmark reference. Changing just the rear motor (EDU1.A) for the XPENG unit – shown by the red polygon – saves ~16 kg of powertrain mass but offers no other benefits as far as the metrics considered within the analysis are concerned.
The difference in efficiency over WLTP between the Audi and XPENG motors is remarkably small (~0.5%). By default, in AWD vehicles, ePOP maximises the use of the rear EDU rather than splitting the torque burden equally between the front and rear. This approach is typically better for efficiency, since motors tend to be more efficient at higher torque for a given speed. The consequence of this strategy choice is reflected by the results showing no difference in vehicle energy consumption when changing the front motor.
If there weren’t improvements to be found by changing one or both of the motors in the Audi, then what opportunities might be found from swapping the inverter? Compared to the standard Hitachi unit in the SQ6 (ADP360120W3), swapping in Tesla’s ST Microelectronics power modules (SCTHS300N75G3AG) is predicted to net a 2% reduction in energy consumption – resulting in the same relative benefits for range, total CO2e lifetime emissions and total cost of ownership.
.avif)
The project has demonstrated the power of ePOP to quickly and easily simulate real-world vehicles to generate virtual benchmarks that can be matched with official figures quoted by the OEMs. Moreover, these virtual benchmarks can then be used as a baseline to intuitively generate fleets of virtual vehicles with powertrains built using mix & match combinations of custom components, allowing novel component designs to be objectively evaluated in real-world applications. The multi-attribute analysis facilitated by ePOP’s post-processing interface provides users with the ability to explore the trade-offs and sensitivities between the powertrains populating the design space through simple-to-make, highly visual representations of the data, giving them a persuasive and compelling means of presenting the advantages of their technologies to potential customers.


